Divergence and True Market Leaders
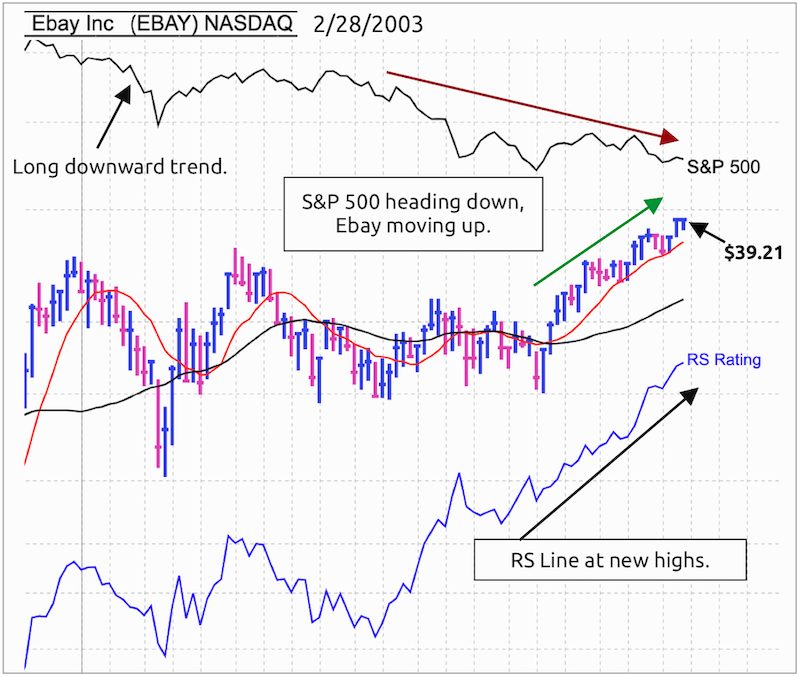
One sign of a potential true market leader is when there is a divergence of the stock’s price action versus the overall market. In this post I’ll show several examples where the S&P 500 was moving down while a stock was moving up, preceding a large gain over the coming months.
Although both values appear next to each other on a MarketSmith chart, the RS Line and RS Rating are quite different in what information they represent. To create a visual to indicate these values are unique, I’ve drawn a red box around the RS Line and a green box around the RS Rating.
EBAY
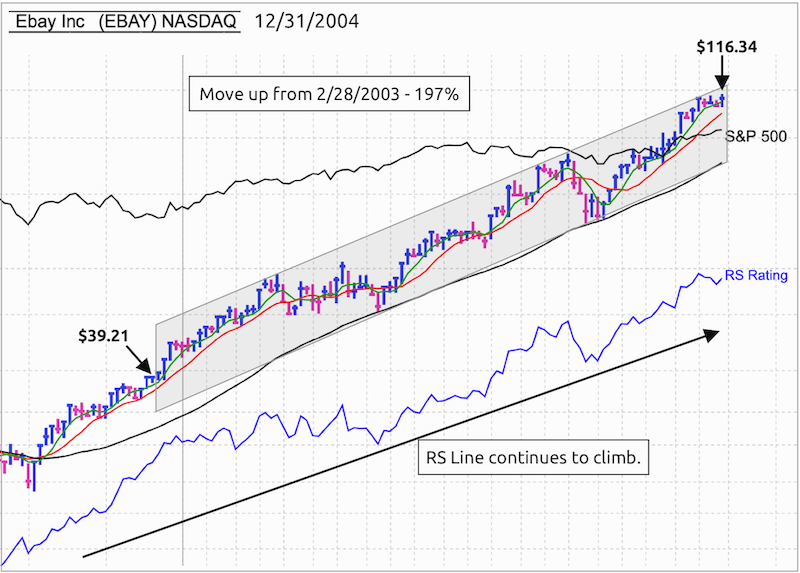
Ebay continued to move up for gain of 197% over 10 months.
OKTA
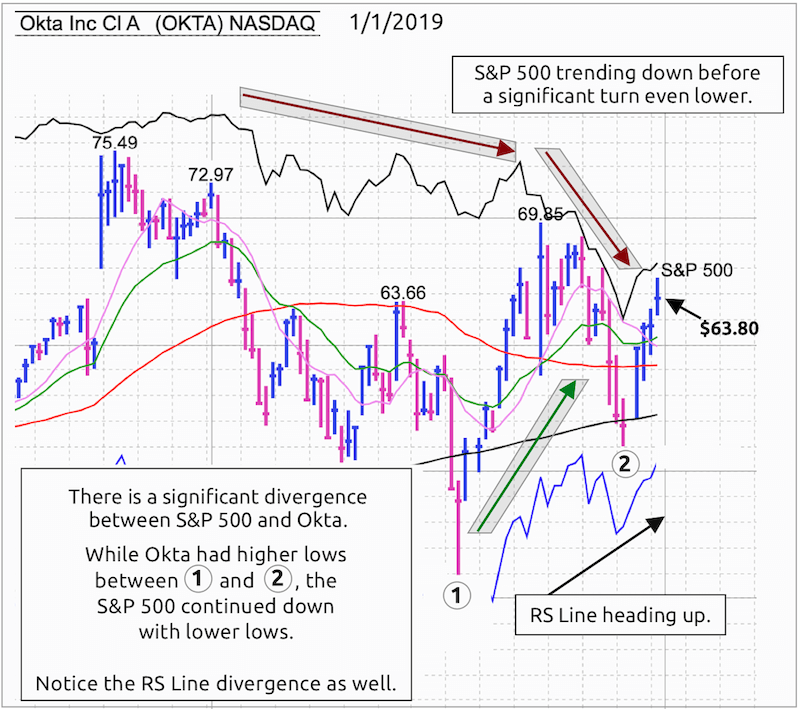
The chart for Okta is a little busy. Hopefully the gray shaded areas help to highlight the divergence between the S&P 500 making a sharp move down while at the same time Okta was making higher lows.
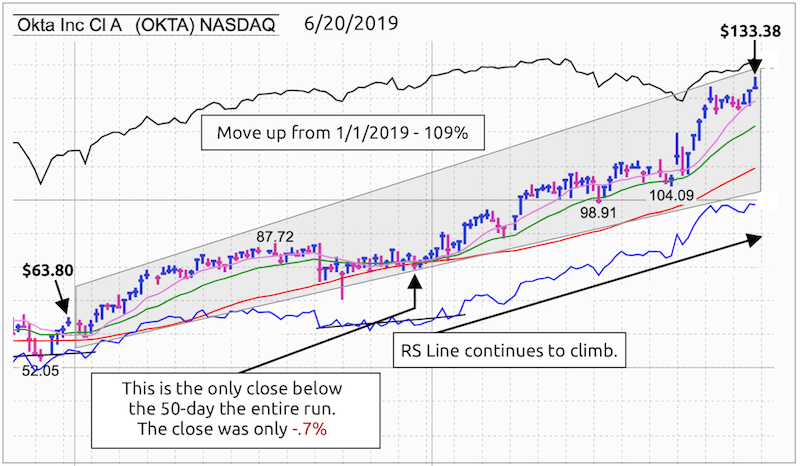
In only 5 months, Okta gained 109%.
ZOOM
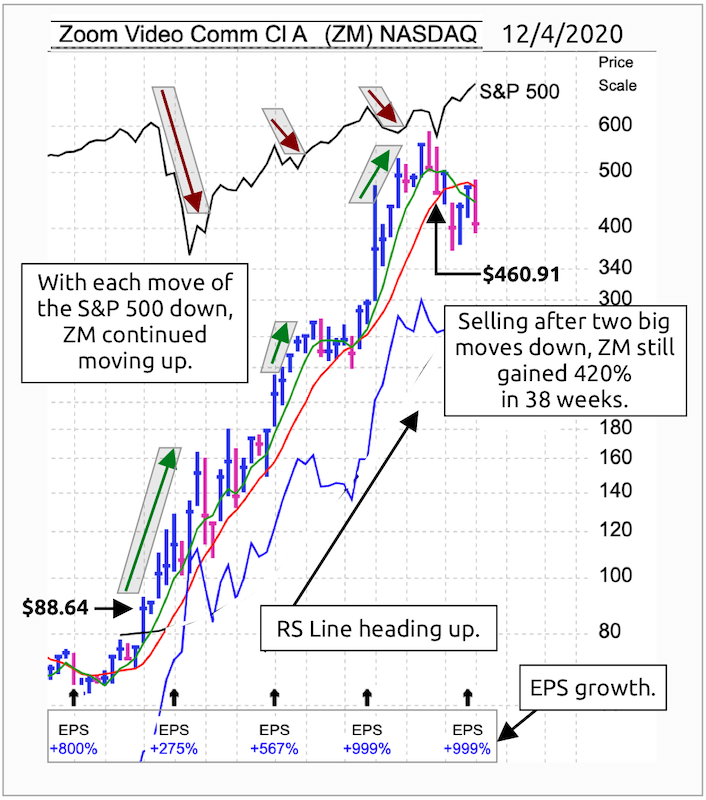
The weekly chart of Zoom shows an impressive run up. Notice that there was only one close below the 10-week moving average in over 38 weeks.
FUBO
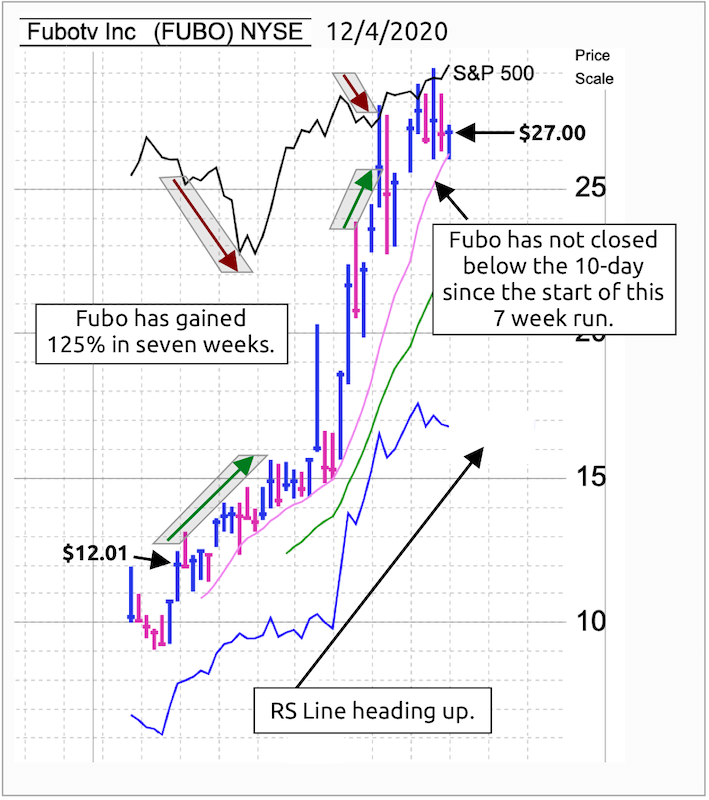
Curious if this same line of thinking applies to IPOs? One look at Fubotv reveals the answer.
