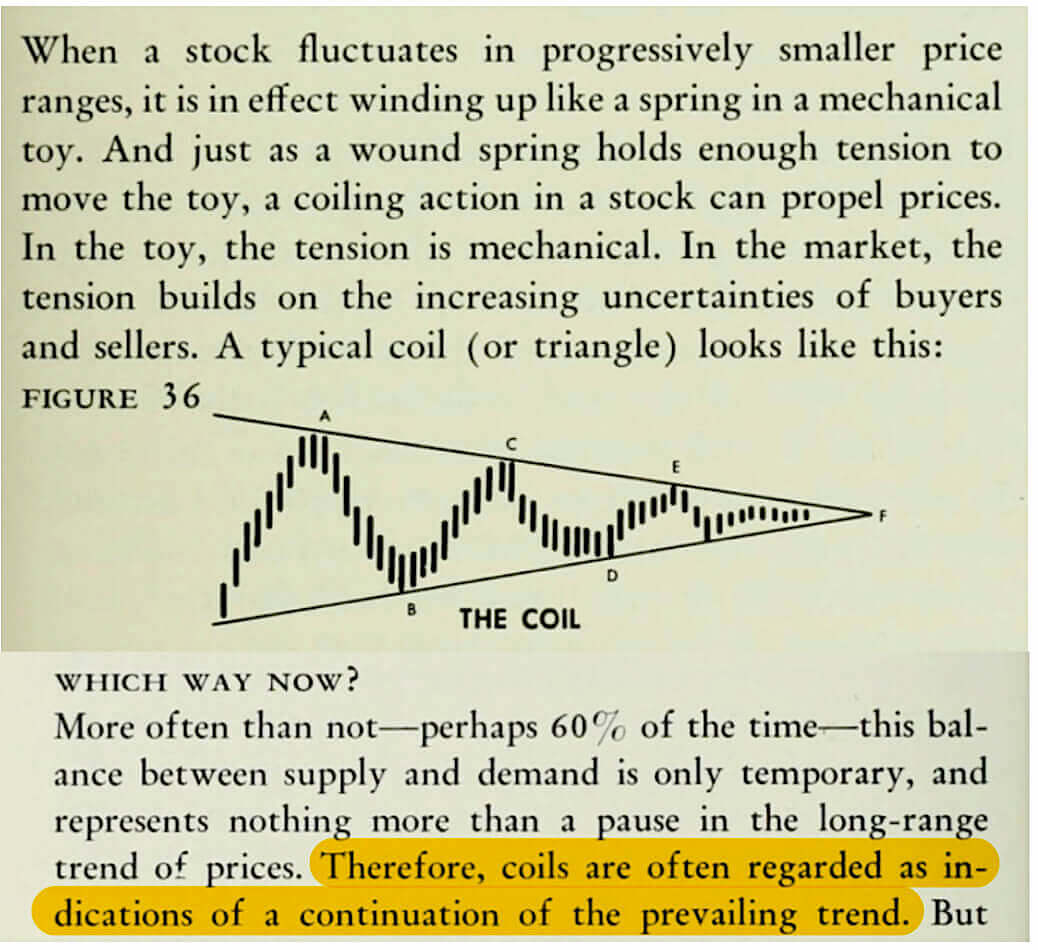
Tape Reading and Market Tactics
The book Tape Reading and Market Tactics by Humphrey B. Neill is a classic text on technical analysis and trading tactics.
Aug 16, 2023
Technical analysis & educational content focused on trading growth stocks.